https://sites.google.com/site/mcguirkmike2/training-schedule/2017
Washing out? Myths and Reality About the Release by Dr. Valery Kleshnev
Eventually (maybe) I’ll bring this new workout post to WordPress but in the meantime, check it out here:
https://sites.google.com/site/mcguirkmike2/training-schedule/2016/july/0716-sat-pbc-4x

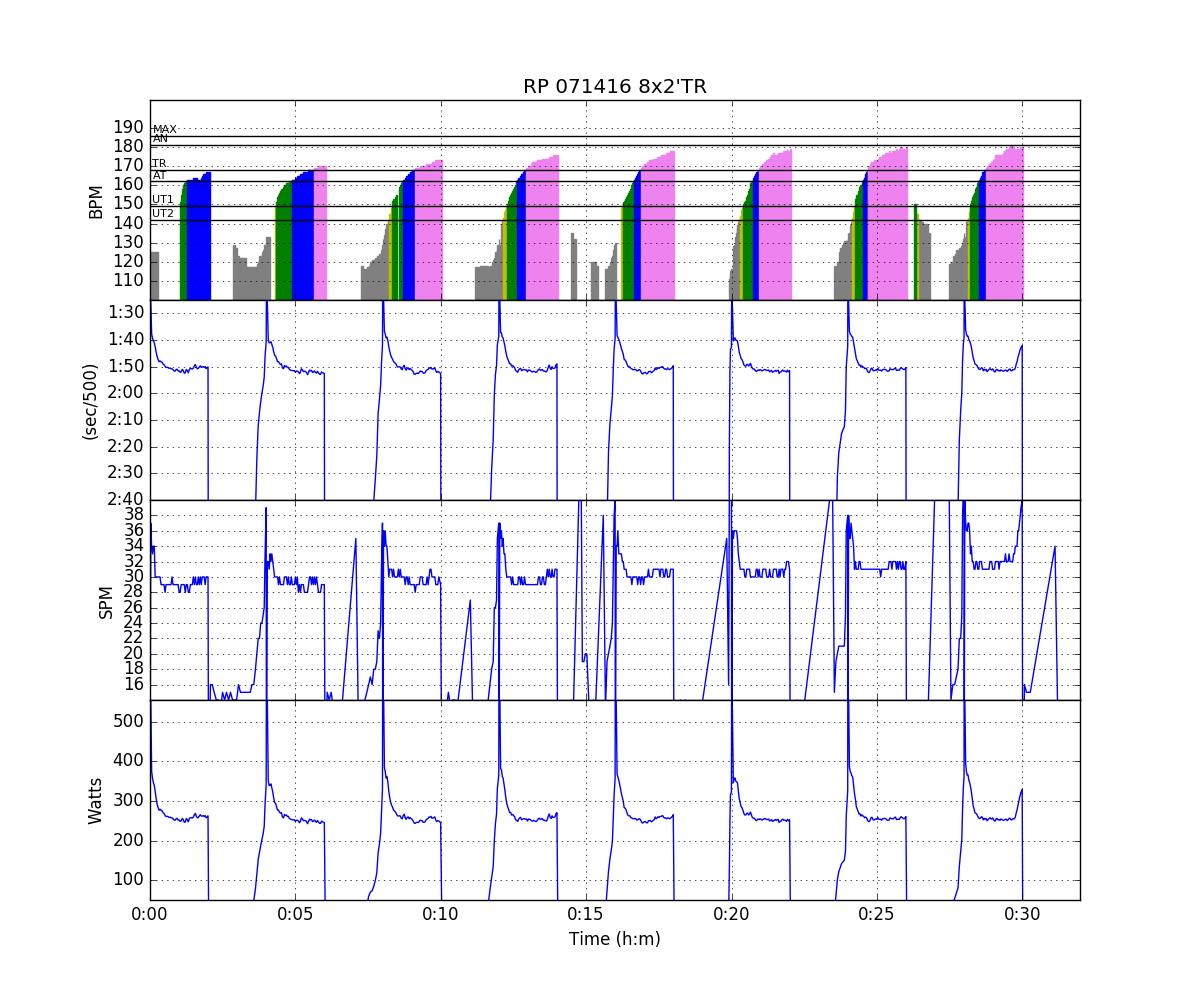
Today was scheduled for an 8×2’x2’TR workout. Going back to June of 2012 (6 records), I’ve averaged 1:48.8, 28.6 spm, 4412m, 9.5 spi on this one:
date | avg pace | spm | distance | spi
| 06/14/2012 | 1:49.2 | 27.0 | 4396 | 9.95 |
| 07/11/2013 | 1:48.9 | 28.3 | 4404 | 9.59 |
| 04/03/2014 | 1:48.5 | 27.3 | 4423 | 10.04 |
| 08/21/2014 | 1:47.3 | 29.3 | 4473 | 9.67 |
| 01/29/2015 | 1:48.8 | 28.9 | 4411 | 9.40 |
| 07/16/2015 | 1:49.3 | 29.5 | 4391 | 9.09 |
| 01/21/2016 | 1:49.5 | 29.8 | 4385 | 8.95 |
| Today | 1:49.0 | 30.9 | 4404 | 8.75 |
This workout closely resembles the classic 8x500m which is a good predictor of 2K performance. As you can see in the table below, pieces average a bit over 550m. So, can I expect to be able to do a 7:20 2K? I feel like I could go faster but maybe I’m being optimistic.
Workout Summary - media/20160714-175403-RP071416-1mo.csv
--|Total|-Total-|--Avg--|Avg-|-Avg-|-Max-|-Avg
--|Dist-|-Time--|-Pace--|SPM-|-HR--|-HR--|-DPS
--|05919|32:00.0|02:42.2|27.1|145.3|181.0|06.8

Workout Details
#-|SDist|-Split-|-SPace-|SPM-|AvgHR|MaxHR|DPS-
00|00550|01:59.7|01:48.8|29.1|96.3|167.0|09.5
01|00276|02:00.0|03:37.4|17.5|130.7|163.0|07.9
02|00549|02:00.0|01:49.3|29.1|147.8|170.0|09.4
03|00212|02:00.0|04:43.0|17.4|131.4|166.0|06.1
04|00550|02:00.0|01:49.1|29.7|156.5|173.0|09.3
05|00217|02:00.0|04:36.5|17.2|129.5|168.0|06.3
06|00550|02:00.0|01:49.1|29.7|160.1|176.0|09.2
07|00216|02:00.0|04:37.8|20.0|129.7|172.0|05.4
08|00550|02:00.0|01:49.1|30.3|149.7|178.0|09.1
09|00122|02:00.0|08:11.8|20.8|121.4|172.0|02.9
10|00550|02:00.0|01:49.1|30.8|159.1|179.0|08.9
11|00169|02:00.0|05:55.0|20.0|135.2|170.0|04.2
12|00551|02:00.0|01:48.9|31.2|168.0|180.0|08.8
13|00195|02:00.0|05:07.7|21.5|136.3|175.0|04.5
14|00554|02:00.0|01:48.3|32.5|164.2|181.0|08.5
15|00108|02:00.0|09:15.6|13.2|132.9|178.0|04.1

The plot above is a snapshot of an interactive plot (pan, zoom, resize, etc. available at Rowsandall.com.
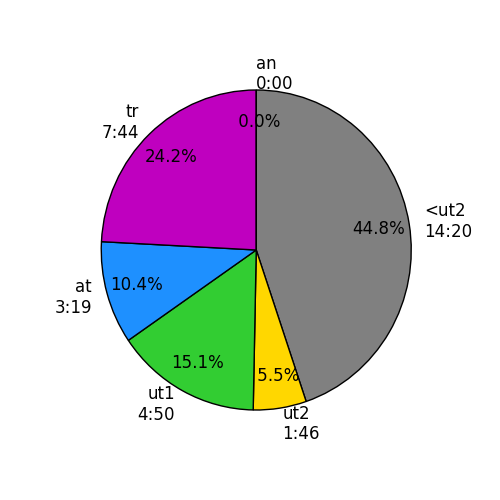
All these plots and the workout summary data were created at Rowsandall.com. For more information go to the website and click ‘About’.
